
Feed producers
Catch process drift while it is still cheap to correct, document what left the mill, and ground process changes in measurements rather than anecdotes.
Measured online. Available everywhere.
The sidometer from nTriones measures a scoop of feed, pellet by pellet, to provide reliable insight into sinking behaviour, size distribution, and the fraction that never reaches the fish, all on site, in minutes.
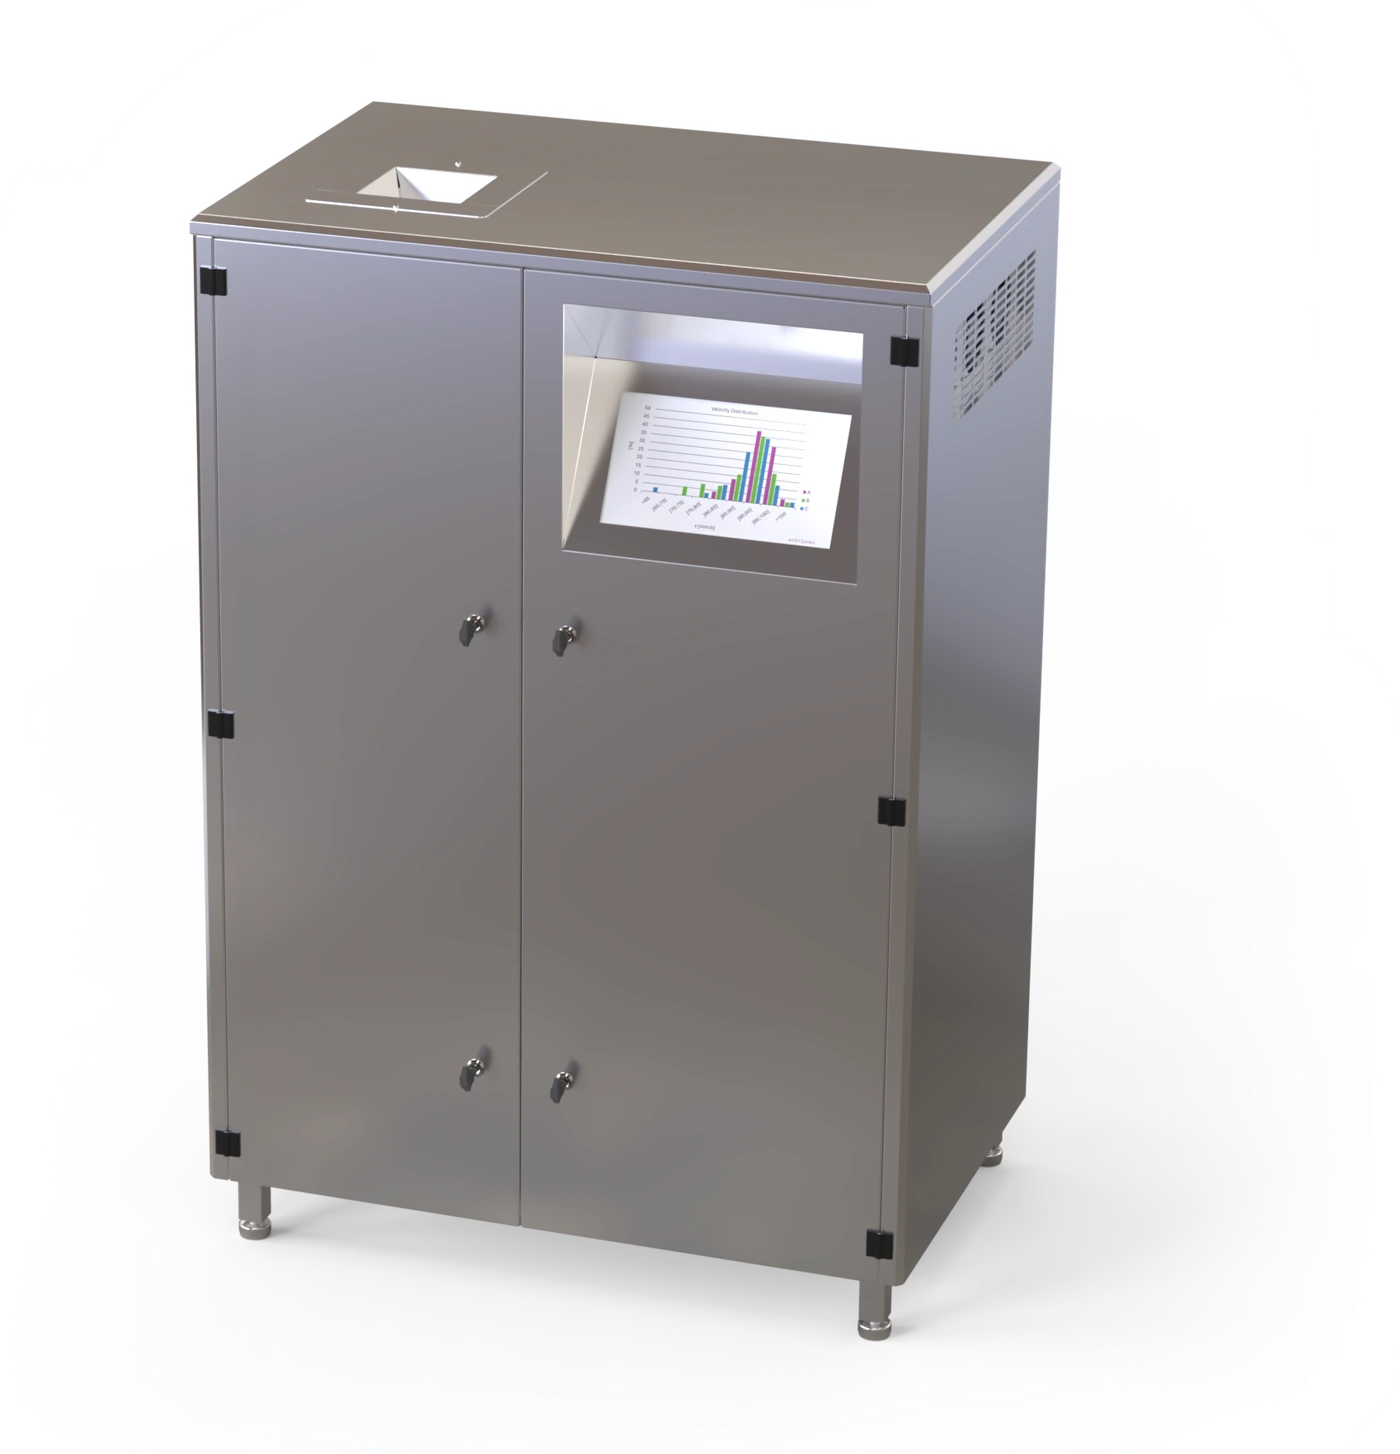
Small changes in sinking behaviour can be the first indication of process instability. The sidometer turns those changes into actionable insight, so you can respond earlier, stabilise production, reduce quality risks and minimise the cost of deviations.
Most manufacturers discover a process deviation only after it has already affected product quality. The sidometer turns sinking speed into a process indicator, so a drift shows itself while it is still cheap to correct.
When sinking behaviour shifts, you know which batch and which shift it started on: a starting point instead of a search.
Extrusion, drying, and coating all leave a signature in how a pellet sinks. Measure it continuously, and the line becomes something you steer, not something you inspect after the fact.
A consistent product is more than an average value. The sidometer reveals the full distribution, helping you distinguish between being within specification and being truly in control.
Bulk density, durability, and moisture are essential quality control parameters, but they describe only overall batch characteristics. They do not reveal how individual pellets vary within a batch. The sidometer captures this variation by analysing pellet size and sinking behaviour across a representative sample. Advanced tracking and statistical algorithms convert hundreds of individual measurements into reliable insight for the entire batch.
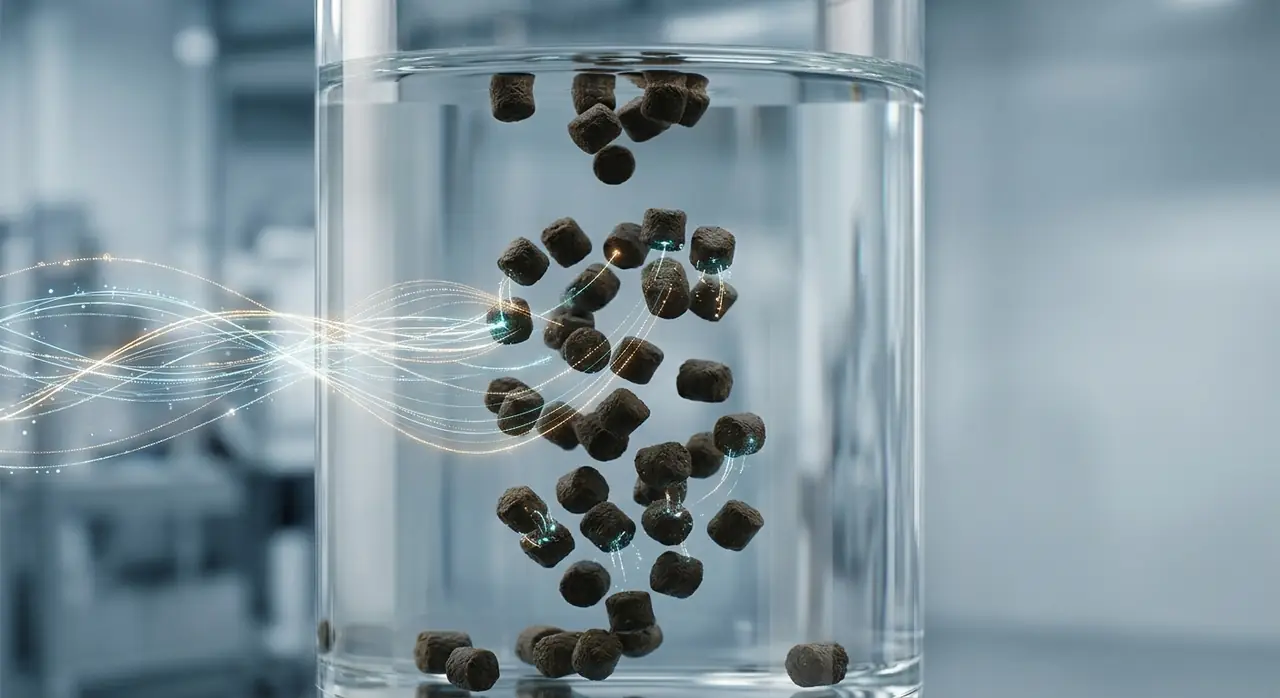
The full velocity profile of the sample (median, spread and tails), the property that decides where in the water column the feed is available to fish.
We measure the full size distribution across the sample, and whether it sits within your expected range or has started to drift.
The fraction that never reaches the fish: surface waste and benthic loss, convertible directly into kilograms of feed lost per tonne fed.
Envelope density inferred for every pellet from its size and settling speed, alongside the sample's bulk figure; the per-pellet spread is what the bulk number on a certificate can't show.
How consistently each pellet sinks, an early, physics-grounded indicator of structural quality, reported alongside the speed distribution.
This is why sinking behaviour is such an efficient indicator: how a pellet sinks integrates the combined effects of density, expansion, size and structural consistency. One measurement, sensitive to all of them, and because sidometer images each pellet as well as timing it, size and settling speed are resolved separately rather than confounded.
Every quantity is reported at two levels: envelope density (pellet by pellet, the distribution and its outliers) and bulk density (the whole-sample figures mills and farms already exchange, directly comparable with the certificate of analysis).
A pellet that sinks correctly in fresh water can hang at the surface in dense winter seawater, and one that sinks fast in a brackish fjord can shoot past the fish entirely. Because sidometer knows each pellet's size, settling speed and envelope density, the same measurement can be projected into water of any chosen salinity and temperature: your site, your season.
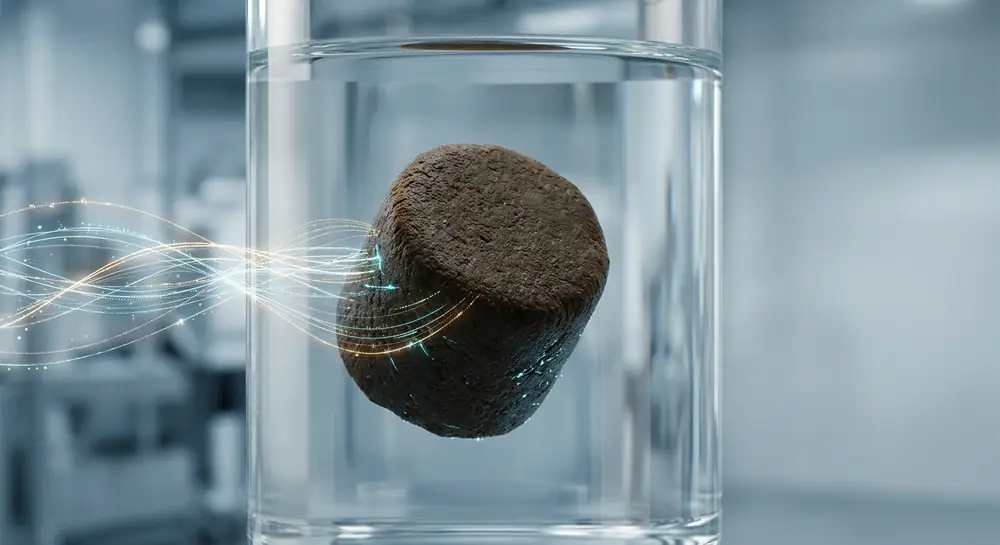
The fraction of pellets expected to remain at or near the surface under your site's water conditions: potential surface waste and increased exposure to bird feeding, identified before the feed is delivered.
The fraction of pellets expected to sink through the feeding zone too quickly and reach the bottom uneaten: potential feed loss below the pen and increased seabed loading.
Measure a delivery once and predict its expected behaviour before the feed arrives at each site. Understand how the same feed will perform under different site conditions, before it is fed.
No samples shipped, no lab queue, no manual counting. The sidometer stands in your process line, the lab or at the barge.
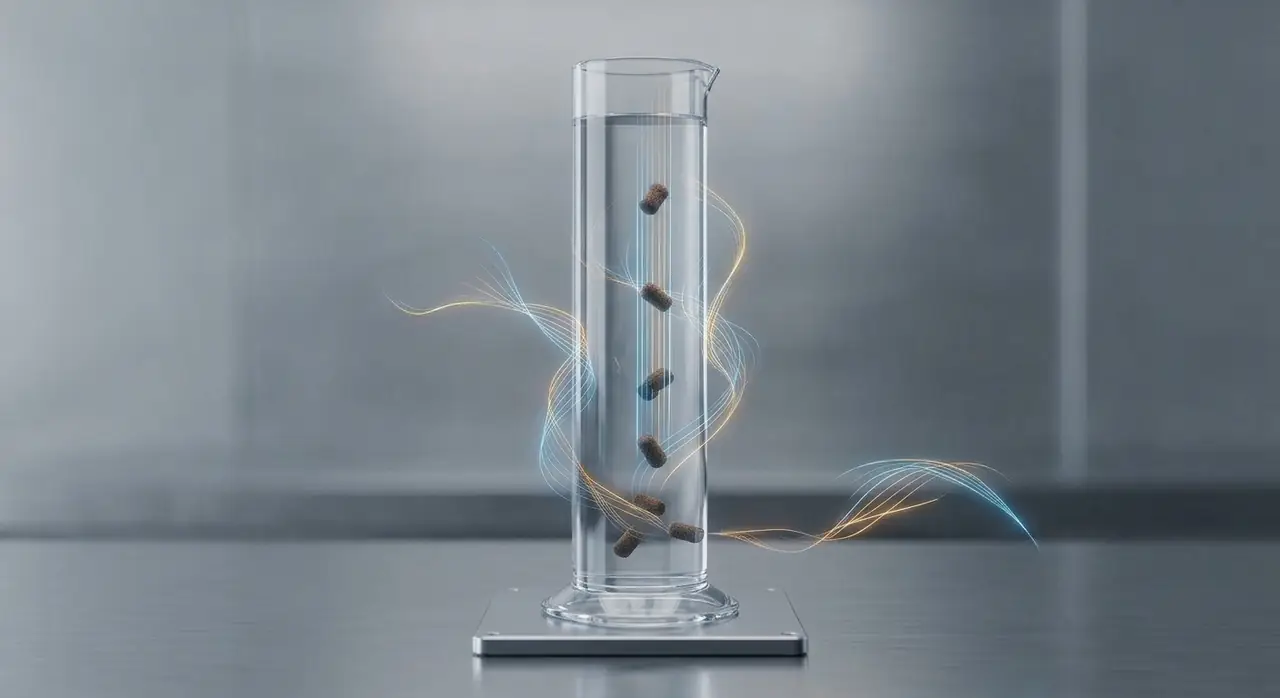
An operator pours a feed sample into the hopper, or an automated sampler feeds the instrument directly from your line.
Each pellet sinks through an illuminated column and is tracked in full 3D from two calibrated viewpoints.
A deep-learning vision pipeline tracks every pellet and computes velocity, size and behaviour: results in minutes, on site.
The full distribution is time-stamped, signed by the device and synced to your dashboard: one record per delivery, kept for good.
Serious measurement science, packaged to run itself and to fit the systems you already have.
Machine learning tracks every pellet as it sinks, and advanced statistical inference turns hundreds of individual measurements into reliable, uncertainty-aware insight about the whole batch.
Automated online sampling, a documented API, a WebDAV endpoint and secure cloud sync let the sidometer integrate into virtually any factory or QC system, so results flow straight into the tools your team already uses.
Precision optics and machine vision are enclosed in an AISI 316 stainless steel cabinet with an industrial touchscreen, bringing advanced measurement technology closer to daily production.
The sidometer is engineered to clean itself between measurements, ensuring it is ready for the next sample. Built for everyday operation in a feed mill or on a feed barge, not just for life on a laboratory bench.
Automated wash cycles keep the measurement column clean between samples and on schedule, with no manual maintenance between deliveries.
Scheduling, self-monitoring and safety interlocks on board; health, results and software updates over a secure connection. It runs; you read the reports.
Beyond spot checks: automated continuous sampling integrates the instrument into a mill or factory line, turning feed QC from an event into a process.
With objective sinking-speed data you can document product performance, support technical discussions with customers, and demonstrate control of your manufacturing process: quantitative, time-stamped and device-signed, batch by batch.
It works in the other direction too. Certification schemes are converging on feed chain-of-custody, and a disagreement about a delivery becomes a five-minute conversation when both sides have the same measurement to point at.
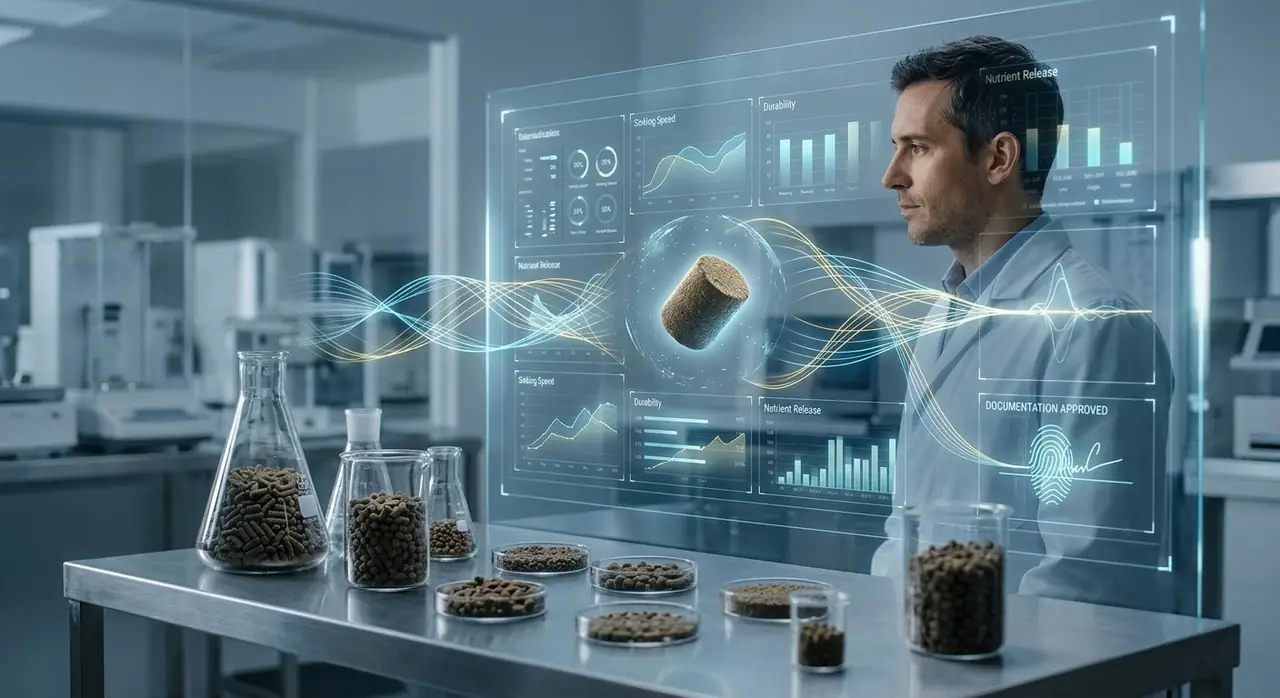
The same instrument, three places in the chain.
Catch process drift while it is still cheap to correct, document what left the mill, and ground process changes in measurements rather than anecdotes.
Know what actually enters the water at the site where feed quality matters most, before a sensitive group is fed a degraded batch.
Replace sieve-and-photograph evidence with a per-delivery instrument record that both parties can accept, before a dispute escalates.
nTriones ApS is an engineering company based in Copenhagen, Denmark, developing advanced measurement technology for the aquaculture industry. The sidometer combines precision optics, a controlled hydrodynamic environment, and on-device machine vision in a system engineered for reliable, long-term operation.
The sidometer is already supporting feed production at the world's largest salmon producer.
Book a demo, or send us a feed sample and we’ll analyse it for you and give you a closer introduction to the sidometer. A pilot takes one instrument, one line, and a few weeks of ordinary production; we’ll show you the variation your current QC can’t see.
Book a demo